by base property specialists
At first glance, August’s rental figures appear to follow the familiar seasonal rhythm - rents climbing during the bustling summer period as tenants reposition for school, university, and new jobs. But peel back the layers and the August 2025 HomeLet Rental Index, in collaboration with PriceHubble, delivers a clear message: the rental market is no longer just moving... it’s shifting. And for landlords, BTR developers, and PBSA investors in London, this moment represents both a warning and an opportunity.
Let’s break down what’s going on, and why the savvy should be paying very close attention right now.
🚀 Rent Growth: Highs and Lows of a Market in Flux
Despite a modest monthly increase in national average rents(+1.1%), annual rental growth has slumped to its lowest level since June2017.
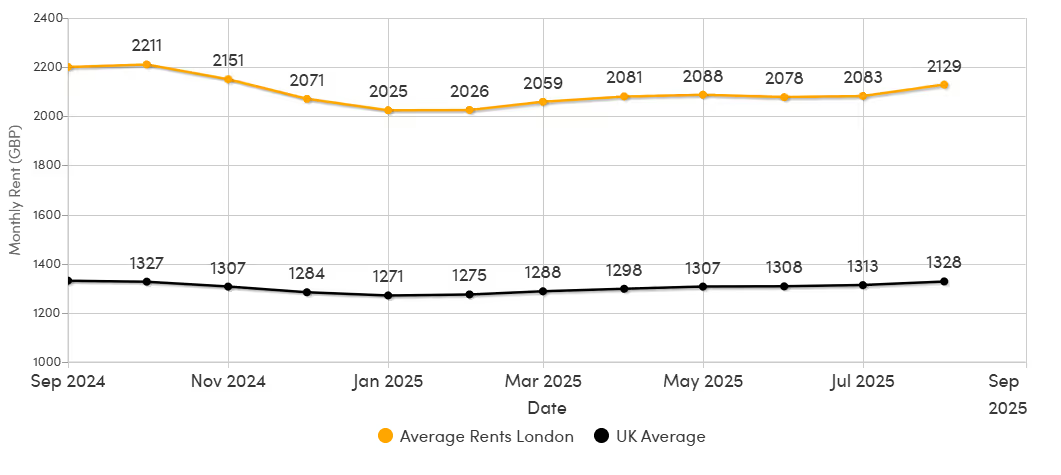
- UK average rent: £1,328
- Excluding London: £1,140
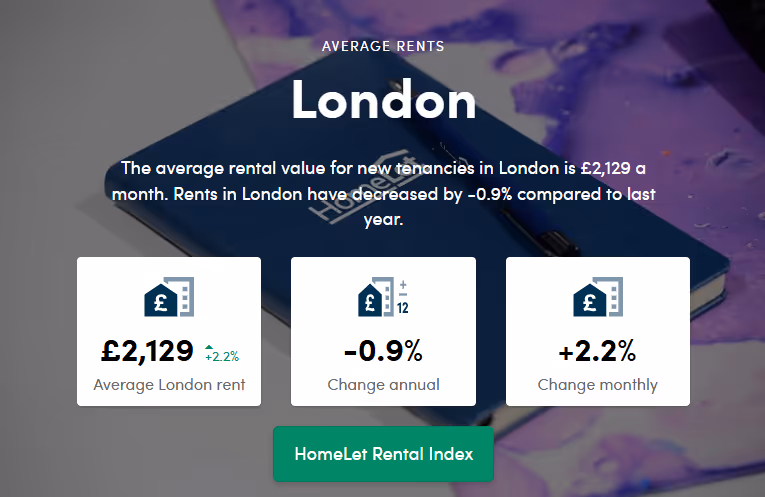
- London average rent: £2,129
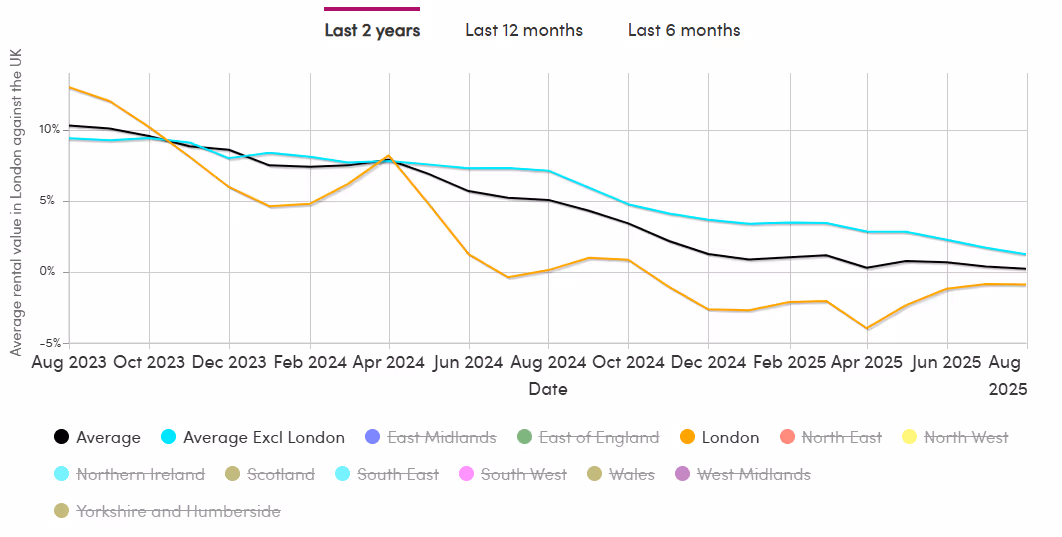
The capital’s 2.2% monthly rent rise in August might sound promising, but it masks a 0.9% annual fall, highlighting how early-year declines are still rippling through.
In short: London remains the UK’s rental heavyweight, but it’s wobbling slightly on its feet.
📍 London’s Patchwork: Some Boroughs Soar, Others Stumble
London is no longer moving in unison. Just 9 of the 21 London regions tracked are now showing year-on-year rental increases, despite 15 boroughs seeing rises in August alone.
🔝 Top Performers (YoY):
- Enfield: +5.7% – the strongest in the capital
- Merton, Kingston & Sutton: +4.9%
- Hammersmith, Fulham, Kensington & Chelsea: +4.2%
⬇️ Underperformers:
- Camden & City of London: -11.2%
- Haringey & Islington: -7.5%
- Barking, Dagenham & Havering: -7.0%
This variance is critical for investors. Broad-brush strategies won’t cut it anymore. Hyper-local knowledge, down to borough, postcode, and even street, will make or break your yields in 2025 and beyond.
📈 Five-Year Growth: The Long Game Still Pays
Despite short-term volatility, long-term growth remains strong. Ealing leads the pack with an eye-watering +52.9% increase in average rent over five years.
This underscores what we’ve long advocated at Base: London remains a long-game city. Whether you're BTL, BTR, or PBSA, the capital's fundamentals - global appeal, density, demand - still dominate.
⚖️ Affordability: The Cracks Are Showing
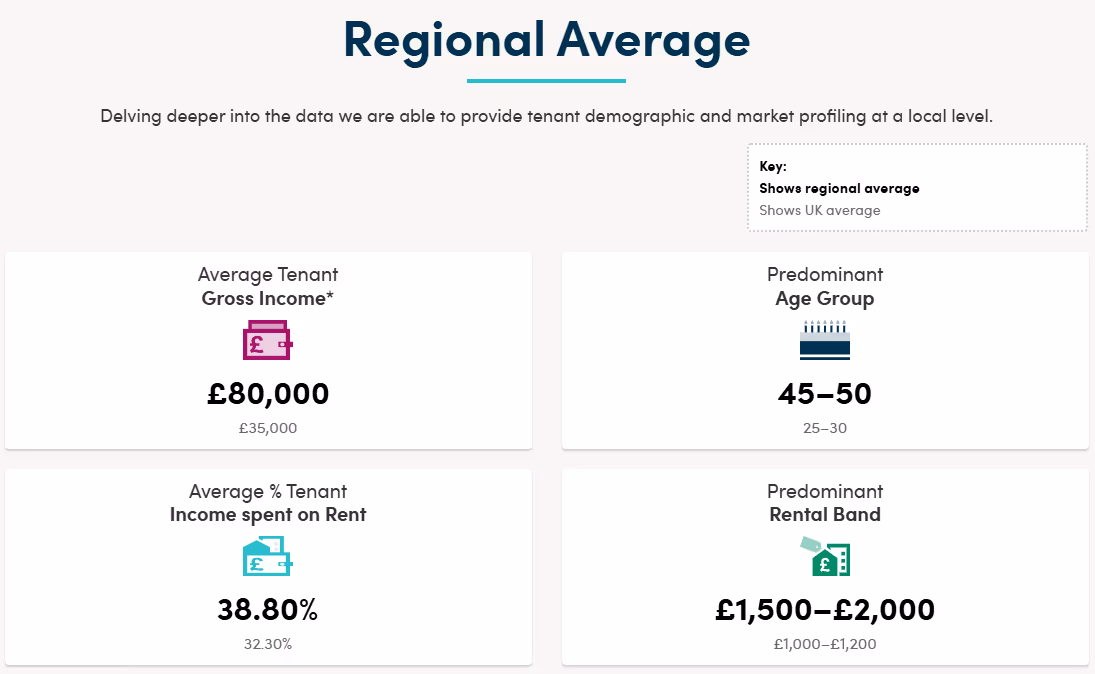
Nationally, renters are spending 32.4% of their income on rent, a minor improvement from last year.
But in Greater London, it’s a different story. 38.6% of gross income now goes to rent, barely changed from last year’s 38.9% and still significantly above the rest of the UK.
Let’s call it what it is: this is the affordability ceiling. Many renters simply can't pay more, regardless of supply-demand dynamics.
For landlords, this means:
- Rent increases must be strategic and defensible.
- Amenities, service, and energy efficiency matter more than ever.
- Technology that supports tenant satisfaction and financial planning isn't a "nice-to-have" - it’s your retention strategy.
🧠 Investor Takeaways: Build Smart, Manage Smarter
Whether you're managing single units or delivering 200+ beds in a BTR scheme, these are our key takeaways for August 2025:
1. Hyperlocal is the new national
Stop thinking “London market”. Start thinking Enfield vs Islington, Walthamstow vs Wimbledon. Granular performance data should underpin every buy and hold decision.
2. Affordability will cap rent rises
Investors banking on endless growth risk missing the bigger picture. Focus on value-driven upgrades: energy performance, smart tech, co-living services, communal amenities.
3. Student & BTR sectors will thrive
With affordability tight and mortgage access still brutal for first-time buyers, the PBSA and BTR markets are positioned to absorb demand, especially for Gen Z and early-career renters.
👉 See the full breakdown on HomeLet Rental Index
👀 Looking Ahead: What's Next?
As one of London’s leading lettings and management specialists, we're watching five trends heading into Q4 2025:
- Increased tenant churn as affordability squeezes loyalty.
- PBSA expansion as international students return in droves post-Brexit, post-COVID, and post-chaos.
- Tech-driven property management rising fast. Smart homes = smart margins.
- Energy efficiency as an investment differentiator, not just a compliance issue.
- Policy shifts likely in 2026, post-election - potentially targeting rent controls or EPC enforcement.
Final Thoughts: Hold Fast, Think Bold
London’s rental market is neither collapsing nor coasting, it’s reshaping. Landlords, investors, and developers who lean into the nuance, embrace transparency, and deliver value will emerge as winners in a tightening field.
At base property specialists, we’ve been challenging the norm since 2004. We're not here to follow the crowd, we’re here to lead the pack. If you're serious about understanding the rental market, not just reacting to it, let’s talk.
📞 Want to deep-dive your portfolio strategy?
Let’s set up a strategy session - BTR, PBSA, or your next buy-to-let.
📍 Proudly rebellious. Proudly Shoreditch. Proudly base.